The word stagflation is a combination of the two words stagnation and inflation. Here, stagnation refers to a state of an economy when the economic growth rate is stagnant or even declining whereas on the other hand inflation refers to a persistent increase in the overall price level of the economy. Before moving ahead, it is important for us to understand unemployment which is the lack of earning opportunities for the ones who are willing and able to work for an earning, as it is an outcome of the stagnation where the overall GDP of the economy either falls or is constant that leads to fall in demand for employment and unemployment increases.
Economists for the first time came across stagflation in the 1970s around the globe. Some of the multiple reasons for this were bad monetary policies and rapid rise in the prices of oil. Recent economists, identify the oil shock of the 1973 as the beginning of the stagflation of the 1970s. Those years most of the world’s oil came from the very few selected nations primarily the middle east who worked under the organisation named OPEC. However, once the western countries made them unhappy they used their influence on the world’s oil supply as an advantage. OPEC decided to limit the supply of the world by the means of oil embargos which are basically OPEC countries purposely limiting the supply of oil to have political influence. When the 1973 oil crisis occurred OPEC had quadrupled the prices of the oil from 290 to 1165 a barrel. Gasoline is considered to be inelastic therefore a large increase in price had a miniscule impact on the demand which created an overall shortage of fuel. With the price of petroleum increasing the price of petroleum based products such as fuel also increased which led to greater transportation cost.
This increase resulted in all other goods experiencing a spike in cost which makes this a leading factor of rapid inflation during the 1970s. Keynesian theory is an exploration of the thoughts and discoveries of John Maynard Keynes. Keynesian theory was the main focus of economic theory and policy after WWII and continued to be the most widely accepted theory until the 1970s when stagflation arrived. The issue with the Keynesian theory was that Keynes did not think of an appropriate response to stagflation.
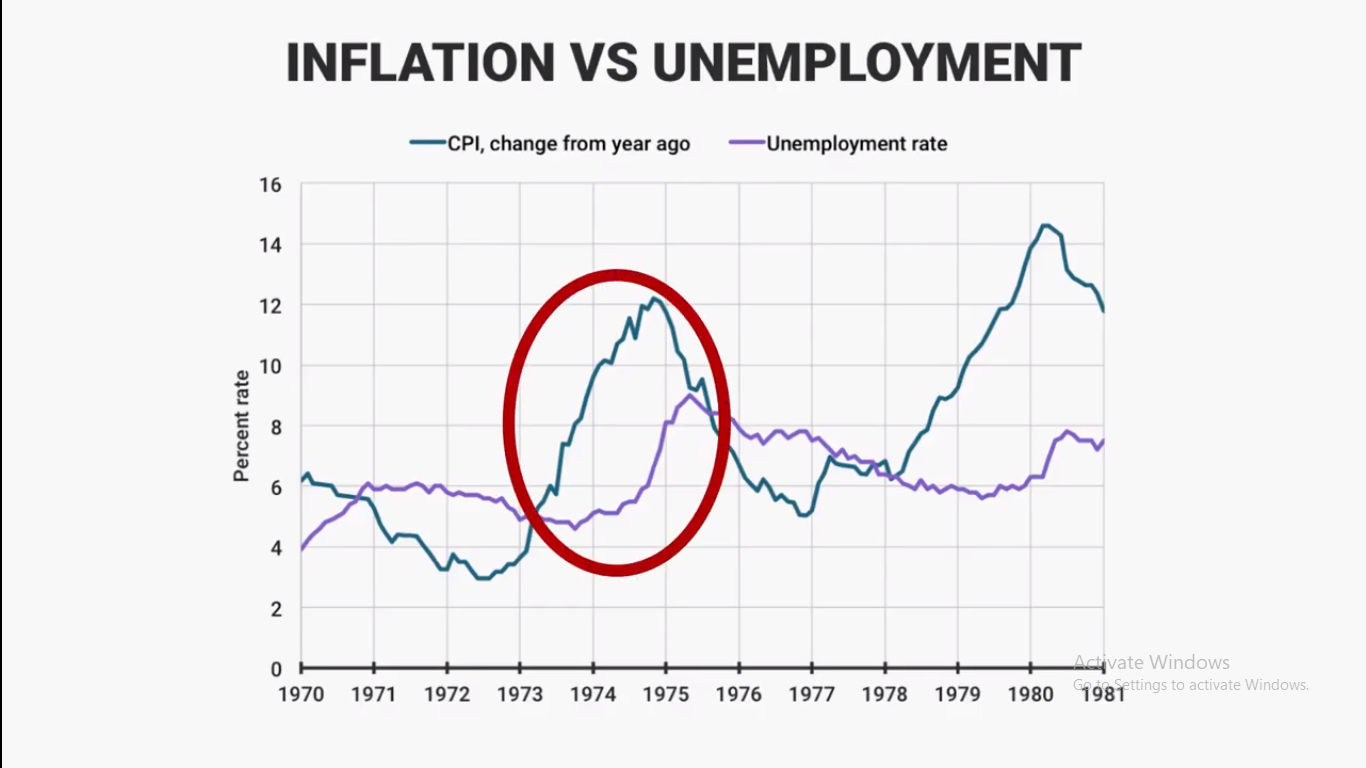
Another Keynesian thinker, AW Phillips had proposed a model that showed a correlation between unemployment and inflation. The conventional form of thinking regarding unemployment and inflation followed a model called Phillips Curve. This model essentially showed an inverse correlation between unemployment and inflation meaning that as inflation went up unemployment went down and vice-versa. But as stagflation occurred this model soon collapsed as shown in the graph below that shows the stagflation in the 1970s clearly as high unemployment and high inflation. Then the Phillips Curve struck the minds of the then policymakers to see high inflation with less unemployment and less inflation with high unemployment. Keynesian theory made the governments thought as of the Phillips curve as the fixture to their problems but as in fact stagflation completely collapsed the Phillips curve as its cure.
Thereafter, there was an another economist Milton Friedman who in 1968 predicted the rise in both inflation and unemployment hand-in-hand in the near future. He believed that the Phillips curve was good just for the short-run, he also mentioned that when the real values are adjusted, unemployment would return to its previous level and leave behind growing inflation with stagnant unemployment. Therefore, he came up with the reduction in the total government spending in any inflation problem including stagflation. He believed that monetary policy alone can curb inflation. Through this we can say that all inflation crisis such as the 1970s oil crisis can be solved by regulating monetary policies and reducing the total government expenditure. Milton Friedman theories of stagflation not just tells us how it occurs but also helps in finding the loopholes in the Keynesian theory.
This crisis made it very difficult for various economies of the world to think of ways to sustain their economies. An example of this is that seeing the continuous rise in oil prices the then US president Richard Nixon tried to shift the country’s dependence from oil to other energy alternatives but he failed because the demand for the oil heavily outweighed to the other energy alternatives. Another example, the liberty party of Canada who was elected in power throughout 1970s was burdened with the task of overcoming stagflation as well so Alberta had to shift its exports from US to other provinces within Canada o their dismay. Whereas, European nations came up with the reduction in the consumption of the oil with the help of the three-day week policy where the people were allowed to use the oil only selected days of the week.
The fundamental problem of scarcity is also quite evident in this crisis of stagflation as during this unemployment, oil and energy was all very scarce. Firms that had the greatest impact of the 1970s stagflation were the oil firms within the countries in the organisation of the Arab Petroleum Exporting Countries. These firms are powerful enough to form policies that have the global impact. The most prominent reason of them having this impact is the
Oligopoly Market of Petroleum. This market structure gives the large only suppliers of the product the authority to emphasise the prices really very well. Thus, this rise in prices also impact the prices of the other oil consuming goods on which we are dependent on in our daily life such as automobile. Therefore, the demand remains inelastic.
The main cause of this was the contradict between the Israel-West siding countries and the Middle-East in the Yom Kippur war and the replacement of Gold with the US Dollars that was the currency of choice for the OPEC trade agreements that led to the decision of OPEC to quadruple the oil prices. Seeing the rise in inflation and stable economic growth the Federal Governments were forced to take the steps to eradicate stagflation from their countries. Different governments had different approaches to counter the problem of stagflation. Canada implemented rebates, wage rollbacks and price increases. The United States introduced price and wage controls along with contractionary monetary policies. The United Kingdom carried out contractionary monetary policies through immense spending cuts as well.
Although the United States was able to get rid of stagflation earliest but in the short run because of poor policies and careless decision making it often faced the problem in different ways for some time. This economic imbalance caused an increase in the welfare spending during the high unemployment rates of the time period. We can understand all of it by seeing the GDP that was around 2.64% in 1960s and fell to 0.55% in 1970s for The United States. Unemployment is another useful model as the employment levels of the 1970s showed lack of growth in the economy. The unemployment rate went just over full-employment in the 1960s to fall by 3% in just following five years.
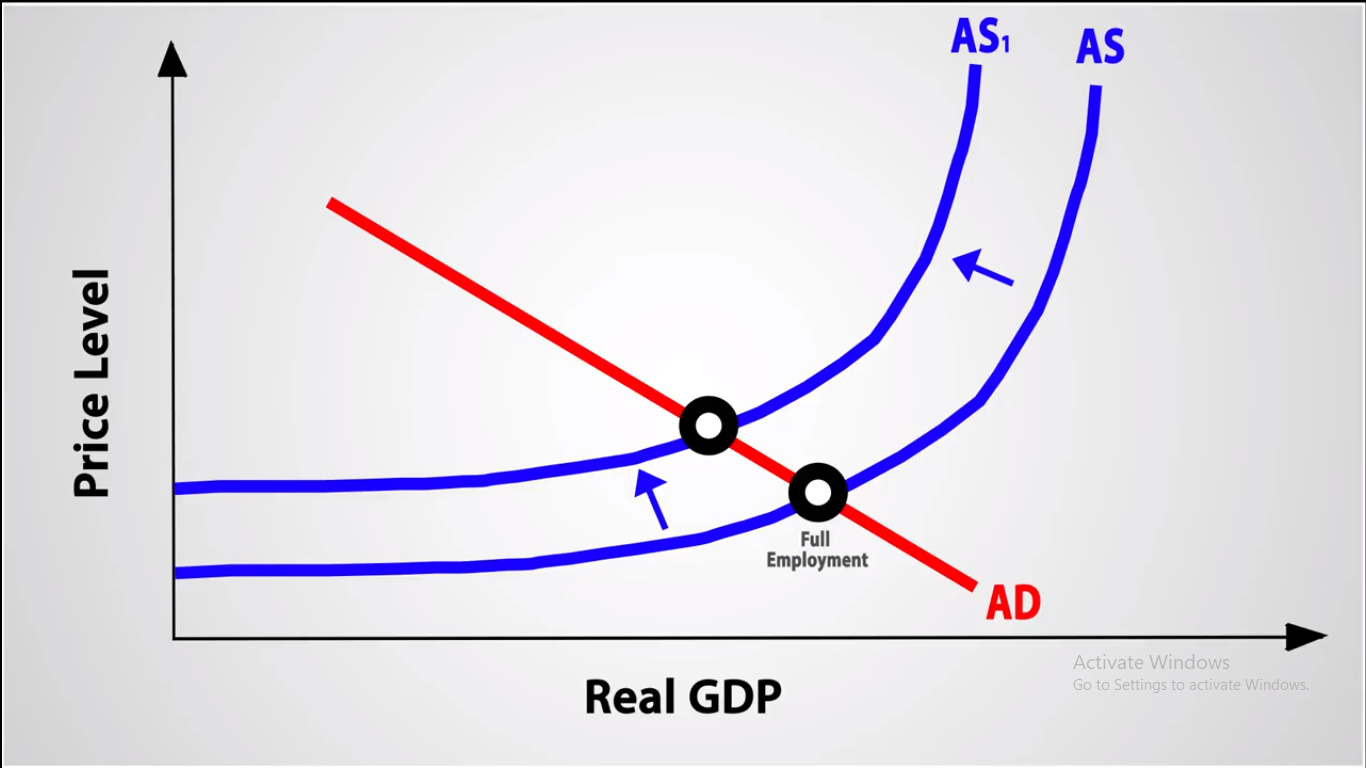
Aggregate supply curves are another useful model to analyse stagflation by looking at aggregate supply in 1970s the effect of cost-push inflation can be clearly identified as one of the most driving forces behind stagflation. Cost-push inflation was a result of massive shortages of oil which forced companies to raise the prices in order to overcome their decrease in production. This is illustrated by an increase in price level and a reduction in productivity. We must also understand the government policies to understand why did stagflation become such a crisis in 1970s. As fiscal policy the government implemented tax cuts and reduced government expenditure to reduce the inflation rates. As a result, it could only be successful in the short-run. Monetary policies were also used to control stagflation but it remained ineffective as stagflation ended only when the inflation rates reached to its peak. Most economists believe that stagflation could have ended much sooner if more aggressive monetary policies were adopted little earlier.
Stagflation also led to the growth in the Income Inequality as prior 1970s the rate of increase in income was nearly equal for he lower, middle and the higher class. But, during the 1970s the rate of increase income for the lower and the middle class people kept of falling adversely that led to higher income inequality. Apart all, in the end the stagflation was soon overcame by the Economic boom in the 1980s.
Critical Analysis
It might, in any case, be accentuated that not all financial experts are eager to acknowledge the idea of the Phillips Curve and the exact proof is as yet the subject of a lot of discussion. Numerous financial experts are certainly miserable about a clarification of swelling which says next to no regarding fiscal conditions. Regardless of whether Phillips connection exists, they feel, it doesn’t really infer that it will helpfully fit macroeconomic basic leadership. As indicated by them changes in costs are at any rate as significant as unemployment in deciding changes in the pay rate.
This is disregarded in the Phillips Curve. The ‘cash dream’ of labourers as proposed by Keynes is to a great extent missing in the present bartering in light of the fact that workers will do their most extreme to hold a lot of national salary, if the equivalent has been disintegrated by rising costs. Financial specialists question whether the bend is steady and whether the exchange off that it indicates really exists. Verifiable in this test to the Phillips Curve is a substitute hypothesis of how specialists act.
We have seen that Phillips model depends on the idea of cash fantasy in the work showcase—which acts to befool the labourers into tolerating lower genuine wages. However, the individuals who are against the hypothesis of cash deception contend that work is less guileless, and that assumptions regarding wages change all the more rapidly. In the event that assumptions regarding genuine wages change rapidly and wages are overhauled in like manner, there is, at that point, little probability of the exchange off among expansion and unemployment.
Market analysts like Milton Friedman and Edmund Phelps have mounted one of the hypothetical assaults on the Phillips Curve property of exchange off among swelling and unemployment. Fundamentally they hold the view that additional time labourers alter their cash compensation in accordance with their genuine wages and thus, they contend, that there is no long-run exchange off as indicated by Phillips Curve.
There is room in this hypothesis, be that as it may, for short-run exchange offs like those predetermined by the Phillips Curve. This view is called ‘the accelerationist hypothesis’— it concedes that in the short-run an unforeseen increment in the rate of swelling will bring down genuine wages and decrease unemployment, however over the long haul there might be no exchange off as appeared in the Fig.-
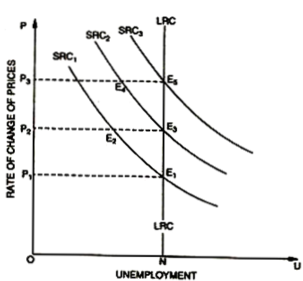
In this Figure unemployment will move alongside the short-run Phillips Curve, SRC1, from point E1 to point E2 (with an expansion in cost from P1 to P2). Be that as it may, when the labourers understand that high cost at P2 is an unavoidable truth, they modify cash pay requests upwards to re-establish genuine wages to the level some time ago held at E2. The resultant increment in genuine wages over those predominant at E2 moves work back to E3 on SRC2, which is a similar degree of unemployment which existed already, with one distinction that at E3 the rate of increment in cash wages and costs is higher than it was previously.
The long-run Phillips Curve LRC is in this manner vertical at point N, and is taken to be the regular rate of unemployment, as controlled by typical contacts in the work showcase. A consequent exertion to decrease unemployment with further swelling by raising costs from P2 to P3 may again be effective in the short-run, making the rate of unemployment decay along SRC2 to E4 from E3.
In any case, if work by and by comes to know about it and modifies the wages after some time, the effect of expansion on business will fall so that regardless of whether the subsequent portion or increment in swelling rises to the first (P1P2 = P2P3), that is, the separation from E5 to E3 the separation from E3 to E 1—the second decrease in work for a given speeding up in the rate of expansion (E5–E3 = E3–E1) will be diminished. The separation from E4 to E5 will be not exactly the separation from E2 to E3.
This obviously clarifies if costs are rising consistently over a significant lot of time, wage increments won’t fall behind increment in costs as work turns out to be completely mindful of cost increments and incorporate lift provisos into contracts. Consequently, the decrease in genuine wages, which is the methods by which the unemployment rate is diminished as generation grows, never again happens. Henceforth, the exchange off among unemployment and swelling vanishes over the long haul.
Unemployment will stay at, what is called normal rate (N) as the labourers figure out how to completely envision the decrease in genuine wages suggested by swelling. Friedman has contended that as of late this degree of regular unemployment has expanded in western economies like UK, USA by virtue of innovative advances that have diminished the interest for work. This factor, joined with the section of countless youngsters and already jobless ladies into the activity advertise, has brought about huge scale unemployment of labourers which the economy can’t ingest, despite the fact that the economy might be at full business.
The decisions are, in this way, either to acknowledge the reality of typical or normal unemployment rate as time goes on more than four percent or to give preparing projects and impact endeavours to expand work portability by improving the progression of data about occupation opening and accessible work. The outcome is move the vertical line at N (normal rate of unemployment) to one side.
REFERENCES
Kennedy, P. (2010). Stagflation. In Macroeconomic Essentials: Understanding Economics in the News (pp. 273-306). MIT Press. Retrieved from http://www.jstor.org/stable/j.ctt5hhjrb.15
COYLE, D. (2014). The Legacy of the 1970s: A Crisis of Capitalism. In GDP: A Brief but Affectionate History – Revised and expanded Edition (pp. 61-78). PRINCETON; OXFORD: Princeton University Press. Retrieved from http://www.jstor.org/stable/j.ctvc77mfx.7
Hunt, B. (2006). Oil Price Shocks and the U.S. Stagflation of the 1970s: Some Insights from GEM. The Energy Journal, 27(4), 61-80. Retrieved from http://www.jstor.org/stable/23297033
SAVILLE, I., & GARDINER, K. (1986). STAGFLATION IN THE UK SINCE 1970: A MODEL-BASED EXPLANATION. National Institute Economic Review, (117), 52-69. Retrieved from http://www.jstor.org/stable/23875258

Chirag ,you have made a very good analysis of this Macro-economic issue…..Good going…
LikeLiked by 1 person
Great Job 👍
LikeLiked by 1 person
Well done…..excellent analysis
LikeLiked by 1 person
Good analysis!
LikeLiked by 1 person
Well described & great analysis for the beginner’s
LikeLike
This article is very useful for the ones who need clarity on Stagflation as a whole.
Great efforts.👍
LikeLiked by 1 person
Good work Chirag .
LikeLiked by 1 person
Very well described about the economic situation and the way economy should work for the better. Great work.
LikeLiked by 1 person
What a analysis brother. Just awesome. Our economists definitely need to see this! Great job.
LikeLike
The interconnectedness between inflation,employment rate and growth rate is interesting. The problems, approaches and solutions to the 1970 issue even more so. Good work mate.
LikeLiked by 1 person
Good job. Keep up the good work. 👌
LikeLiked by 1 person
A well described ananlysis.. great work..✌🏻✌🏻
LikeLiked by 1 person
Well defined article.
LikeLiked by 1 person
Great work and researches in your work keep it up my dear and my best wishes is always with you.
LikeLiked by 1 person
Great efforts Chirag.
LikeLiked by 1 person
It was really informative. Good work guys.
LikeLiked by 1 person
Well written, extremely appreciable.. Keep it up!
LikeLiked by 1 person
Well executed and informative. Keep up the good work.
LikeLiked by 1 person
great job… excellent effort.. keep going.. 👍👍
LikeLiked by 1 person
Very well explained.
LikeLiked by 1 person
To the point and yet extremely informative. Great work.
LikeLiked by 1 person
Quite informative. Keep it up
LikeLiked by 1 person
Very well written.
LikeLike